

Abstract
Checkpoint blockade therapy triggers tumor-specific immune responses in a variety of cancer types. We presumed that rectal cancer patients could have become sensitive to immunotherapy after receiving neoadjuvant chemoradiotherapy (nCRT). In this study, we report immune alternation in post-nCRT patients compared with pretreatment conditions from gene-expression omnibus (GEO) data. Whole-exome sequencing of 14 locally advanced rectal cancer (LARC) patient samples showed that nCRT induced new mutations compared with the paired pretreatment biopsies, evidenced by appearance of a neoantigen landscape. An association was identified between mutation burden and enrichment of immune activation–related pathways. Animal experiment results further demonstrated that radiotherapy enhanced the efficacy of anti–PD-1. Mutation burden and the neoantigens of LARC patients were associated with response to nCRT. The mRNA expression profiling of 66 pretreatment biopsy samples from LARC patients showed that immune activation–related pathways were enriched in response to nCRT. PD-L1 expression was negatively correlated with disease-free survival in the CD8-low expression patient group who received nCRT in a cohort of 296 samples. Thus, nCRT was able to alter immune function in LARC patients, which may be associated with the appearance of neoantigens. Neoantigens could make rectal cancer patients potential candidates to receive checkpoint blockade immunotherapy, and mutation burden could be a useful biomarker to stratify patients into responding and nonresponding groups for immunotherapy. Cancer Immunol Res; 6(11); 1401–16. ©2018 AACR.
Introduction
The treatment guidelines published by the National Comprehensive Cancer Network of the United States clearly state that preoperative neoadjuvant chemoradiotherapy is crucial for rectal cancer treatment, which can improve the rate of curative resection and significantly reduce local recurrence (1, 2). Although local recurrence and overall survival have improved, distant recurrence rate has not decreased significantly. About 30% of patients treated with a curative regimen will eventually develop distant metastases (3–5). Adjuvant drug therapy has been used to prevent distant metastases by eliminating circulating tumor cells and micrometastases. However, the use of adjuvant chemotherapy for patients with rectal cancer treated with preoperative chemoradiotherapy and surgery is still controversial (6). Administration of adjuvant chemotherapy to patients with stage II or III rectal cancer was based on results from phase III trials of adjuvant treatment for colon cancer (7–10), as well as from trials in patients with rectal cancer who were treated without preoperative chemoradiotherapy (11). Fluorouracil-based adjuvant chemotherapy did not improve overall survival, disease-free survival, or distant recurrences (6, 12).
Colorectal cancers with a high density of tumor-infiltrating lymphocytes (TILs), especially CD8+ T lymphocytes, are associated with a better prognosis (13–16), suggesting that a cytotoxic antitumor immune response is involved in controlling cancer progression. Checkpoint blockade immunotherapy has improved cancer treatment. Along with radical surgery, radiotherapy, chemotherapy, and targeted oncogene treatment, checkpoint blockade is on the top of the list of therapeutic options. Checkpoint blockade therapy utilizes monoclonal antibodies (mAb) to rescue suppressed T cells through activating and restoring their antitumor activity (17). Similarly, targeting cytotoxic T lymphocyte–associated antigen 4 (CTLA-4) and programmed cell-death protein-1 (PD-1) pathways in metastatic melanoma, non–small-cell lung cancer (NSCLC), and other malignancies has significantly prolonged survival (18–20).
Despite revolutionary achievements, the efficacy of checkpoint blockade immunotherapy varies among different tumor types, and a few cancer types, such as colorectal cancer, appear to be refractory to this therapy (19, 21). A notable exception is that patients with mismatch-repair (MMR)-deficient colorectal cancer lesions obtain clinical benefits from the administration of anti–PD-1 (22).
Increasing evidence indicates that antitumor effects, clinically noted with checkpoint inhibitors such as ipilimumab, may rely on boosting tumor-specific immune responses that were preexisting or newly induced. High somatic mutation loads are correlated with responsiveness to PD-1 blockade therapy in NSCLC, melanoma, and MMR-deficient colorectal cancers (22–24). Research has revealed that radiation can not only reduce tumor burden but also enhance antitumor immune responses to tumor cells (25). The combination of radiotherapy, anti–CTLA-4, and anti–PD-L1 promotes clinical responses in melanoma (26).
Therefore, we hypothesized that rectal cancer patients could be potential candidates for checkpoint blockade immunotherapy after receiving nCRT. To test this hypothesis, whole-exome sequencing of rectal cancer pre- and post-nCRT samples was performed to analyze the mutational landscape differences. We further performed an integrative analysis of mutational landscape and gene expression using The Cancer Genome Atlas (TCGA) and gene-expression omnibus (GEO) data to evaluate the influence of somatic mutations and their association with immune response induced by treatment.
Materials and Methods
Patients and samples
Sample collection and usage was approved by the Ethics Review Committees of Peking University Cancer Hospital and Institute and was in accordance with the Declaration of Helsinki. All patients were informed prior to the study, and a consent form was signed by each participant.
Tumor and paired normal adjacent tissue samples from cohort 1 included 14 LARC patients who received nCRT and were used for whole-exome sequencing. Nine paired LARC tumor tissues were obtained pre- and post-nCRT, and the remaining patients only had pretherapy biopsies due to complete pathologic response (pCR) or near pCR after nCRT. Pretreatment blood samples from cohort 2 consisted of 42 LARC patients who received nCRT and were used for circulating tumor DNA (ctDNA) extraction and targeted ctDNA sequencing. The normal adjacent biopsies from patients of cohort 2 were obtained for tissues DNA extraction and used as controls. All the tissue and blood samples were from patients who received nCRT and surgical resections between 2014 and 2016 at the Peking University Cancer Hospital and Institute (Beijing, China). Pretreatment tumor staging was performed in all patients using endorectal ultrasonography, pelvic magnetic resonance imaging, or computed tomography. The radiotherapy regimen consisted of a 50.6 Gy dose delivered in 22 fractions, with concurrent capecitabine treatment at a dose of 825 mg/m2 orally twice per day for 5 weeks.
Inclusion criteria were as follows: (i) diagnosis of rectal adenocarcinoma by biopsy and (ii) tumor staged as T3–4 or any T, N+ by endorectal ultrasonography, pelvic magnetic resonance imaging, or computed tomography. Exclusion criteria were as follows: (i) previous chemotherapy or pelvic radiation and (ii) presence of any other malignant disorders or other chronic diseases. For cohort 1, biopsies pre-nCRT collected by rectoscopy and tissue samples collected by surgical resection were immediately frozen in liquid nitrogen and stored at −80°C until use. For cohort 2, 3.5 mL of venous blood was collected prior to nCRT from each patient and processed within 1 hour based on protocols of NCI's Early Detection Research Networks. Plasma was harvested after centrifugation twice at 1,600 × g for 10 minutes immediately for ctDNA extraction or stored at −80°C. In order to generate differential mRNA profiling between responders and nonresponders to nRT and evaluate the influence of PD-1 and PD-L1 on prognosis after neoadjuvant therapy, large-scale cohorts of pretherapy biopsy and cancerous tissue samples were selected and categorized into cohorts 3, 4, and 5.
Cohort 3 was composed of biopsy samples from 66 patients before nRT and resection. All patients were treated with intermediate-fraction nRT (30 Gy/10 fractions) followed by a total mesorectal excision (TME) surgery. The patients achieving grade 0 and 1, evaluated using the tumor regression grade (TRG) system, were defined as responders. The patients with grade 3 were defined as nonresponders. Inclusion criteria were as follows: (i) diagnosis of rectal adenocarcinoma by biopsy; (ii) tumor staged as T3–4 or any T, N+ by endorectal ultrasonography, pelvic magnetic resonance imaging, or computed tomography; and (iii) no evidence of distant metastasis. Patients with the following characteristics were excluded: (i) previous chemotherapy or pelvic radiation and (ii) presence of any other malignant disorders or other chronic diseases. Biopsies were collected by rectoscopy and stored immediately in RNAlater (Qiagen) and then stored at −80°C until use.
Cohort 4 consisted of 294 colorectal cancer patients who did not receive nRT, and the samples were collected after surgical resection. Patients with stage I–IV colorectal cancer, and with clinicopathologic characteristics and follow-up information available, were included. We excluded patients if they had any other malignant disorders or other chronic diseases, previous treatment with any anticancer therapy, presence of any tumor type other than adenocarcinoma or mucinous carcinoma, and familial adenomatous polyposis colorectal cancer.
Cohort 5 included 296 samples from patients who received nRT, and the samples were collected after resection. The radiation dosage was 30 Gy and delivered in 10 fractions over 2 weeks. Inclusion criteria were as follows: (i) diagnosis of rectal adenocarcinoma by biopsy; (ii) tumor staged as T3–4 or any T, N+ by endorectal ultrasonography, pelvic magnetic resonance imaging, or computed tomography; and (iii) no evidence of distant metastasis. Patients with the following characteristics were excluded: (i) previous chemotherapy or pelvic radiation and (ii) presence of any other malignant disorders or other chronic diseases. For cohorts 4 and 5, tumor tissue samples were directly collected after surgical resection. All samples were immediately frozen in liquid nitrogen at −80°C or fixed in 10% formalin for paraffin embedding. A summary of the clinical characteristics of these patients is shown in Supplementary Tables S1 to S5.
Assessment of treatment response and tumor downstaging
The 7th edition of the American Joint Committee on Cancer TNM system was used for pathologic staging (27). Neoadjuvant radiotherapy effect was evaluated after surgery by specialized gastrointestinal pathologists using TRG system as follows: grade 0, complete regression, no tumor cells; grade 1, single or small groups of tumor cells, moderate response; grade 2, residual cancer outgrown by fibrosis, minimal response; grade 3, minimal or no tumor cells killed, poor response.
Whole-exome capture and sequencing
Sample preparation, library construction, exome capture, next-generation sequencing, and bioinformatics analysis were performed at Shanghai Biotechnology Corporation. Genomic DNA from cohort 1 tumor samples was randomly fragmented and used to construct an in vitro shotgun library. For each sample to be sequenced, individual library preparations, hybridizations, and captures were performed following the protocol of SureSelectXT Target Enrichment System for Illumina Paired-End Sequencing Library (Agilent Technologies, Inc.). Briefly, the library fragments were flanked by index adaptors following end repair and A-tailing addition. The library was further enriched with biotinylated probes (from the SureSelect biotinylated library mix) for sequences corresponding to exons through aqueous-phase hybridization capture. The hybridized fragments were captured by streptavidin-based magnetic beads (Dynabeads MyOne Streptavidin T1, Life Technologies, cat. #65603), followed by amplification, quality inspection, and massive parallel sequencing of the enriched library. Quantity of library was assessed with Qubit 2.0 Fluoromete. The quality and size range was assessed using 2100 Bioanalyzer High Sensitivity DNA Assay as instructed in the reagent kit guide. BaseCalls directory, containing the binary base call files (BCL files), was generated by Real-Time Analysis (Illumina). The bcl2fastq (v1.8.3, Illumina) was used to combine the per-cycle BCL files in each run and translate them into FASTQ files. The FASTQ files were aligned to a human reference genome (hg19) by Burrows-Wheeler Aligner (BWA, v0.7.12; refs. 28, 29; Sanger Institute). The aligned files (SAM/BAM format files) were initially sorted by SAM tools (ref. 30; v0.1.19, Sanger Institute). The aligned read duplicating the start position of another read was flagged as a duplicate (“Mark duplicate”) by using Picard Tools (v1.107, Broad Institute). Data were processed using the Genome Analysis Toolkit (GATK, v3.1, Broad Institute). Reads were locally realigned (GATK IndelRealigner), and the base qualities were recalibrated (GATK BaseRecalibrator). Final mapping statistics, including coverage and depth, were generated from recalibrated files by BED tools (ref. 31; v2.16.1, Quinlan Laboratory at the University of Virginia) and perl/python scripts. The readings were further formatted with SAM tools, duplication was removed with Picard, local realignment around InDels was processed by GATK IndelRealigner, and base quality score recalibration was performed by using GATK Base Recalibrator. Potential somatic substitutions were identified using GATK Unified Genotyper followed by variant annotation through ANNOVAR/VEP/snpEFF.
Somatic mutations were determined using MuTect2 (ref. 32; Broad Institute) to identify mutations in matched tumor and normal samples. A detailed MuTect2 procedure is available at http://www.broadinstitute.org/cancer/cga/mutect/. The paired sample data were finally filtered by ANNOVAR (ref. 33; Wednesday, June 17, 2015, Center for Applied Genomics, Children's Hospital of Philadelphia, Department of Biostatistics and Epidemiology and Department of Pediatrics, University of Pennsylvania, Philadelphia, PA) for further analysis.
Targeted ctDNA sequencing
Sample preparation, library construction, exome capture, next-generation sequencing, and bioinformatics analysis were performed at Genecast Biotechnology Co. Ltd . Plasma from cohort 2 blood samples was harvested after centrifugation twice at 1,600 × g for 10 minutes and aliquoted immediately for ctDNA extraction or stored at −80°C. ctDNA was extracted from 2 mL of plasma using the MagMAX Cell-Free DNA isolation kit (Life Technologies) and quantified by Qubit dsDNA HS Assay kit or Qubit dsDNA BR Assay kit (Life Technologies).
Genomic DNA was sheared into 150 to 200 bp fragments with Covaris M220 Focused-ultrasonicator Instrument (Covaris). Fragmented DNA and the ctDNA library were constructed by KAPA HTP Library Preparation Kit (Illumina platforms, KAPA Biosystems), following the manufacturer's instructions. DNA libraries were captured following NimbleGen SeqCap EZ Library SR (Roche) Users’ Guide, with a designed 0.8M size panel (Genecast Biotech), which included 325 major tumor-related genes. The captured samples were subjected to Illumina HiSeq X-Ten for paired-end sequencing.
Paired-end reads generated from Hiseq X-Ten platform were mapped to the hg19 reference genome with BWA v0.7.12 (default parameters; refs. 28, 29; Sanger Institute), then sorted, filtered, and indexed with SAM tools (ref. 30; 1.3, Sanger Institute). In order to identify somatic single-nucleotide polymorphisms and indel mutations, the obtained BAM files from both plasma and matched normal tissues from each patient were processed for pairwise variant calling using VarScan (ref. 34; v2.3.8, The Genome Institute, Washington University, St. Louis, MO). Minimum coverage for calling somatic variants in matched normal tissues samples and plasma samples were 5 and 3, respectively. P value threshold to call a somatic site was 0.05, and variants with ≤90% strand bias were kept for further study. The generated candidate mutations were annotated using ANNOVAR software (ref. 33; Wednesday, June 17, 2015, Center for Applied Genomics, Children's Hospital of Philadelphia, Department of Biostatistics and Epidemiology and Department of Pediatrics, University of Pennsylvania, Philadelphia, PA), the dbNSFP and Exome Aggregation Consortium database were used to remove either the benign mutations with pp2_hdiv score ≤ 0.452 or the population polymorphic sites. Finally, the resulted nonsynonymous mutations at the exonic regions were reserved. Tumor mutation burden (TMB) was defined as the number of nonsynonymous mutations per megabase of exonic region.
MMR status testing
MMR status was assessed using the MSI Analysis System (Promega), consisting of 5 pseudomonomorphic mononucleotide repeats (BAT-25, BAT-26, NR-21, NR-24, and MONO-27) to detect MSI and 2-pentanucleotide repeat loci (PentaC and PentaD). According to the manufacturer's guidelines, a 2-ng template DNA for each sample was added into the amplification mix, including nuclease-free water, gold ST*R buffer, MSI primer pair mix, and AmpliTaq Gold DNA polymerase (Life Technologies; cat. #N8080242) and mix gently. For the positive amplification control, 2 ng of the diluted K562 high-molecular-weight DNA was added into the amplification mix. For the negative amplification control, nuclease-fee water (instead of template DNA) was added into amplification mix. Amplification was performed in a GeneAmpR PCR System 9600 (Applied Biosystems). Amplification conditions were as follows: 95°C for 11 minutes, 96°C for 1 minute; then 94°C for 30 seconds, ramp 68 seconds to 58°C, hold for 30 seconds, ramp 50 seconds to 70°C, hold for 1 minute, for 10 cycles; then 90°C for 30 seconds, ramp 60 seconds to 58°C, hold for 30 seconds, ramp 50 seconds to 70°C, hold for 1 minute for 20 cycles; then 60°C for 30 minutes, 4°C soak. The primers used were provided in the MSI Analysis System (Promega). Following amplification of DNA, the fluorescent PCR products were analyzed with the Applied Biosystems 3130xl Gene Analyzer using GeneScan analysis software (Applied Biosystems). The length of the sequence was determined for each microsatellite locus, and the tumors were designated as high-frequency MSI (MSI-H) if two or more mononucleotide loci variations were identified in length compared with the germline DNA. One variation was considered as low-frequency MSI (MSI-L) and none as microsatellite stable (MSS).
RNA isolation and microarray analyzes
Total RNA from cohort 3 biopsy samples was isolated using TRIzol reagent (Life Technologies), according to the manufacturer's instructions, and purified by using the RNeasy Mini Kit (Qiagen). RNA samples of each group were subsequently used to generate fluorescence-labeled cRNA targets for the Affymetrix Human U133 Plus 2 arrays (Affymetrix; cat. #900467). The labeled cRNA targets were then hybridized on slides. After hybridization, slides were scanned by GeneChip Scanner 3000 (Affymetrix). Data were extracted with Command Console Software 4.0 (Affymetrix). Raw data were normalized by the MAS 5.0 algorithm and Gene Spring Software v12.6.1 (Agilent technologies). The microarray experiments were performed following the protocol of Affymetrix Inc. (Shanghai Biotechnology Corporation).
Cell lines
The MC38 cell line was purchased from the National Infrastructure of Cell Line Resource (Beijing, China) and was maintained in RPMI 1640 with 10% fetal bovine serum (Gibco), penicillin sodium (100 U/mL), and streptomycin sulfate (100 mg/mL) in humidified 5% CO2 at 37°C. The cell line was tested and authenticated by short tandem repeat profiling. Cells were routinely tested for mycoplasma infection and used only when negative. Cells were passaged a maximum of 3 to 4 times in vitro before they were used in in vivo experiments.
In vivo mouse studies
Four- to six-week-old male C57BL/6 mice were purchased from Beijing Vitalriver Experimental Animal Technology Co. Ltd. Mice were maintained in a pathogen-free facility and used in accordance with the institutional guidelines for animal care. All animal experiments were performed following protocols approved by the Institutional Animal Care and Use Committee at the Peking University Cancer Hospital. MC38 (1 × 10⁴) cells were mixed with an equal volume of Matrigel (BD Biosciences) and subcutaneously injected on the right leg of the mice on day 0. The tumors were irradiated with 8 Gy on day 15. Blocking antibodies (PD-1, clone RMP1-14; PD-L1, clone 10F.9G2 and rat IgG2B isotype, clone LTF-2; all from Bio X Cell) were given intraperitoneally on days 16, 19, and 22. All irradiation was performed using the Edge linear accelerator (Varian Medical Systems, Inc.). Antibodies used for in vivo immune-checkpoint blockade experiments were given intraperitoneally at a dose of 200 μg/mouse and include PD-1 (clone RMP1-14), PD-L1 (clone 10F.9G2), and rat IgG2B isotype (clone LTF-2; all from Bio X Cell). The tumor volumes were measured using CT scans and MRI once a week. Volume was calculated using the formula L × A × B × 0.52, where L is the longest dimension and A and B are long and short diameters of the largest coronal section, respectively. The untreated tumor volumes were determined at day 14 using CT scans and were considered as a baseline tumor volume (Vcont). Normalized tumor response to treatment was the measured volume (V) relative to Vcont. The tumor volumes were also measured using calipers every 3 days. Differences in survival were determined for each group by the Kaplan–Meier method. The overall P value was calculated by the log-rank test. For mouse studies, an event was defined as death or when tumor burden reached a protocol-specified size of 1.5 cm in maximum dimension to minimize morbidity (26).
IHC analysis on tissue microarrays (TMA)
IHC was performed on TMAs using rabbit polyclonal anti-human PD-1 (LS-B540, LifeSpan BioSciences), anti-human PD-L1 (ab58810, Abcam), anti-human PD-L2 (HPA013411, Sigma), and mouse monoclonal anti-human CD8 (clone 4B11, Novus Biologicals). All images were examined by two experienced pathologists independently. For PD-L1 and PD-L2, the immunoreactivity of the proteins detected was recorded through the intensity of staining, and the percentage of immunoreactive cells scored as: tissues with no staining were rated as 0, with a faint or moderate staining to strong staining in <25% of cells rated as 1, strong staining in 25% to 50% of cells rated as 2, and strong staining in >50% of cells rated as 3. The slides were further analyzed to identify PD-1 and CD8 using an image analysis workstation (Spot Browser, Alphelys). The total number of PD-1+ or CD8+ cells in each tissue spot was counted, and the density of PD-1+ or CD8+ TILs was defined as the cell number per square millimeter.
TCGA and GEO data sets
Level 3 TCGA RNA-seq and DNA exome-seq data for rectal cancer patients with clinical information were downloaded from the TCGA data portal, including 341 rectal cancer samples on July 18, 2015. The cases that had clear information about nCRT were analyzed, including 7 rectal cancers with nCRT and 41 without nCRT. EdgeR-normalized data of these 48 cases were used for correlative analysis.
Two patient data sets of rectal cancer were downloaded from the GEO database. GSE 15781 consisted of 22 patients with resectable adenocarcinoma of the rectum, in which 13 patients had surgery only, and 9 patients received nCRT. GSE 45404 included pretreatment biopsies of 42 rectal cancer patients who received nCRT with conventional fractionation (≥50 Gy in 28 fractions, 1.8 Gy/day, 5 sessions per week) and 5-fluorouracil (5-FU)–based chemotherapy.
Mutant peptide MHC binding prediction
All nonsynonymous point mutations identified were translated into strings of 17 amino acids, with the mutant amino acid situated centrally according to previous research (23, 24). Our initial analysis was focused on HLA-A and HLA-B (reference set of 27 alleles was assembled and covered >97% of population; ref. 35), the accession numbers for the reference alleles were shown in Supplementary Table S6. The 17 mutant amino acid fragments were analyzed by the epitope prediction program NetMHC v4.0 (http://www.cbs.dtu.dk/services/NetMHC/). Epitopes with a predicted affinity of <50 nm were considered to be strong potential binders, and epitopes with a predicted affinity of <500 nm were considered weak potential binders, as suggested by the NetMHC group. To further refine the total neoantigen burden, we repeated the same process for the complementary wild-type peptide for each mutant peptide. The mutant peptides that held strong potential binders were used to compare with the complementary wild-type peptide, which was predicted to have a weak potential binder. These mutant peptides were referred to as mutation-associated neoantigens. These mutant peptides were further evaluated for putative binding to the T-cell receptor (TCR) using the IEDB immunogenicity predictor with patient-specific HLA types (http://tools.immuneepitope.org/immunogenicity/) and CTLPred (http://www.imtech.res.in/raghava/ctlpred/).
Statistical analysis
The Mann–Whitney test and Student t test were used to compare mutation burdens and differences in the frequency of nucleotide changes. The log-rank test was used to compare Kaplan–Meier survival curves. Correlations between the nonsynonymous mutation burden and the neoantigen burden, frequency of the neoantigen burden/nonsynonymous mutation, and immune response were calculated using the Pearson correlation formula. A mixed-effect linear model was used to determine significance of differences in tumor growth. Statistical analyses were performed using GraphPad Prism v.6.
Availability of data and material
Whole-exome sequencing data are available under the NCBI Sequence Read Archive study accession no. SRP159539. Microarray data are prepared according to minimum information about a microarray gene experiment guidelines and deposited in the GEO database. The GEO accession number is GSE119409.
Results
nCRT induces immune activation in LARC
To assess whether nCRT could affect the immune response, we compared rectal cancer samples with and without treatment from GEO data (GSE 15781) using GSEA. These data consisted of 22 patients with resectable adenocarcinoma of the rectum. Thirteen patients had surgery only, and 9 patients received nCRT. The irradiated and nonirradiated tumor tissues and normal tissues were used to perform genome-wide gene-expression analysis. A supervised method (Significance Analysis of Microarrays; SAM) was initially used to identify a statistical significance (adjusted P < 0.05) in differentially expressed genes between samples with and without nCRT treatment. Differentially expressed genes (3,359) were identified between these two subgroups. Of which, 1,840 genes revealed significantly higher expression in posttreatment samples, whereas 1,519 genes showed lower expression. A hierarchical clustering analysis was subsequently performed based on the expression values of the 3,359 genes in the 22 samples (Supplementary Fig. S1) to categorize the samples into two main subgroups (branches), in which the gene expressions showed the opposite trend.
To further investigate the mechanism of the immune response alternation after the chemoradiotherapy, the differentially expressed genes induced by chemoradiotherapy with the immune-related genes defined by Gene Ontology (1,776 genes) were compared. A total of 342 immune-related genes were altered, with most being upregulated. Unsupervised hierarchical clustering of this subset of overlapping genes resulted in a clear separation of the samples by nCRT (Fig. 1A and B).

nCRT induces immune activation of LARC. A, Unsupervised clustering highlighting genome-wide changes in gene expression. Rectal cancer samples were clustered according to the expression of 342 differentially expressed immune genes (P < 0.05) between 13 pre- and 9 post-nCRT samples (GSE 15781). Rectal cancer samples are shown across the horizontal axis, with 1 sample expression pattern shown in each column. Gene-expression values range from green (low expression) to red (high expression). B, Venn diagram showing significant overlaps of core genes from the differentially expressed genes (red circle), immune-related genes (blue circle), and CD28 costimulatory related genes (green circle). C, Unsupervised clustering for 17 differentially expressed immune genes for CD28 costimulatory signals (P < 0.05) between pre- and post-nCRT. D, Unsupervised clustering for T-cell differentiation and activation markers between pre- and post-nCRT. E, Enriched pathways for differentially expressed immune genes after nCRT using GSEA. The 20 most significant pathways and corresponding normalized enrichment scores (NES) are shown. P ≤ 0.01, FDR q < 0.25 using enrichment score calculation, permutation test, and multiple-hypothesis test.
nCRT induces immune activation of LARC. A, Unsupervised clustering highlighting genome-wide changes in gene expression. Rectal cancer samples were clustered according to the expression of 342 differentially expressed immune genes (P < 0.05) between 13 pre- and 9 post-nCRT samples (GSE 15781). Rectal cancer samples are shown across the horizontal axis, with 1 sample expression pattern shown in each column. Gene-expression values range from green (low expression) to red (high expression). B, Venn diagram showing significant overlaps of core genes from the differentially expressed genes (red circle), immune-related genes (blue circle), and CD28 costimulatory related genes (green circle). C, Unsupervised clustering for 17 differentially expressed immune genes for CD28 costimulatory signals (P < 0.05) between pre- and post-nCRT. D, Unsupervised clustering for T-cell differentiation and activation markers between pre- and post-nCRT. E, Enriched pathways for differentially expressed immune genes after nCRT using GSEA. The 20 most significant pathways and corresponding normalized enrichment scores (NES) are shown. P ≤ 0.01, FDR q < 0.25 using enrichment score calculation, permutation test, and multiple-hypothesis test.
Reactome pathway analysis showed that immune activation–related pathways were induced, including interferon signaling, antigen presentation, class I MHC-mediated antigen processing and presentation, PD-1 signaling, peptide–ligand binding receptors, and costimulation from the CD28 family (Table 1). Among the altered 342 immune-related genes, 17 genes fell into the CD28 costimulatory signal pathway (defined by Reactome pathway database; Fig. 1B). CD28, CD86, HLA class II molecules, PIK3CA, PTPN11, MAPKAP1, GRB2, VAV1, FYN, and MAP3K8 were upregulated (Fig. 1C). In contrast, PAK1, PPP2R1A, and MLST8 were downregulated. The expression of T-cell differentiation and activation markers were analyzed, and the results revealed that differentiation markers (KLRG1 and PTPRC) and activation markers (CD69, IL2RA, CD38; refs. 36, 37) were upregulated in LARC samples following nCRT (Fig. 1D).
Reactome pathway analysis with nRT versus without nRT (GSE15781) and mutation-related pathways (TCGA)
| With nRT vs. without nRT (GSE15781) | Mutation-related pathways (TCGA) | ||||
|---|---|---|---|---|---|
| Pathway name | Entities P value | Entities FDR | Pathway name | Entities P value | Entities FDR |
| Interferon gamma signaling | 1.11E−16 | 1.21E−14 | Developmental biology | 5.67E−11 | 2.34E−08 |
| Antigen presentation: Folding, assembly, and peptide loading of class I MHC | 1.11E−16 | 1.21E−14 | Alpha-defensins | 8.46E−08 | 2.61E−05 |
| Immunoregulatory interactions between a lymphoid and a nonlymphoid cell | 1.11E−16 | 1.21E−14 | NCAM signaling for neurite outgrowth | 2.39E−06 | 5.89E−04 |
| Class I MHC-mediated antigen processing and presentation | 1.11E−16 | 1.21E−14 | Interleukin-2 family signaling | 2.17E−05 | 0.002010602 |
| Cytokine signaling in immune system | 1.11E−16 | 1.21E−14 | Signaling to RAS | 3.58E−05 | 0.002010602 |
| Receptor binding chemokines | 1.34E−13 | 1.34E−11 | RAF/MAP kinase cascade | 5.59E−05 | 0.002010602 |
| PD-1 signaling | 7.64E−07 | 6.65E−05 | Interleukin receptor SHC signaling | 9.43E−05 | 0.002545513 |
| Peptide ligand-binding receptors | 1.71E−06 | 1.39E−04 | Interleukin-19, 20, 22, 24, 26, 28, and 29 signaling | 1.47E−04 | 0.003831806 |
| Costimulation by the CD28 family | 2.71E−05 | 0.00195 | Interleukin-3, 5, and GM-CSF signaling | 2.05E−04 | 0.005137273 |
We then focused on the differentially expressed genes and performed gene set enrichment analysis using a prior defined immunologic signature set (signature of gene expression upon perturbation of certain immune-related genes). Posttreatment LARC was characterized by increased expression of most immune-related genes and associated with a diffuse immune infiltrate mainly composed of TH1 cells and cytotoxic T cells expressing checkpoint molecules (Fig. 1E).
To further assess the effect of nCRT on the infiltration of specific immune cell subsets, we used CIBERSORT (38) as an approach to dissect infiltration of specific immune cell subsets in the tumors. The higher fractions of monocytes, activated dendritic cells, and neutrophils cells were found in rectal cancers with nCRT. The faction of gamma delta T cells slightly increased from 0% to 0.78% following nCRT (Supplementary Fig. S2). The lists of differentially expressed genes, immune genes, and CD28 costimulatory signals are presented in Supplementary Tables S7 to S9.
nCRT influences the mutational landscape of LARC
Pre- and post-nCRT tumor samples from 9 of the 14 patients of cohort 1 were collected and sequenced, and the other 5 cases only had biopsy samples prior to therapy because of pathologically invisible tumor masses after achieving pCR. The tumor DNA sequencing generated a mean target coverage of 239×, and a mean of 99.8% of the target sequence was identified as a depth of minimum 10×. A median of 80 nonsynonymous mutations per pre-nCRT sample (range, 3–313) was detected. The median number of exonic mutations per pre-nCRT sample was 122 (range, 3–455). The microsatellite instability status of the 9 cases was tested, and all cases were MSS. The quantity and range of mutations were similar to published series of colorectal cancers (22). The nCRT-induced mutations appeared in posttreatment samples. The median number of exonic mutations induced by nCRT was 23 compared with pretreatment samples (range, 8–89). The median nonsynonymous mutation induced by nCRT was 15 per post-nCRT sample (range, 6–57).
nCRT influences the neoantigen landscape of LARC
The landscape of neoantigens was examined according to previously described methods (23, 24). This approach identified mutant nonamers with ≤500 nmol/L binding affinity for patient-specific class I human lymphocyte antigen (HLA) alleles, which were considered candidate neoantigens. A median of 58 candidate neoantigens from each pretreatment tumor (range, 0–256) and the quantity of neoantigens per tumor correlated with mutation burden were identified (Pearson r = 0.9491, P < 0.0001; Fig. 2A). New mutations induced by nCRT from posttreatment tumors also resulted in a median of 11 candidate neoantigens with a range of 3 to 50. These candidate neoantigens significantly correlated with new mutation numbers (Pearson r = 0.9640, P < 0.0001; Fig. 2B).
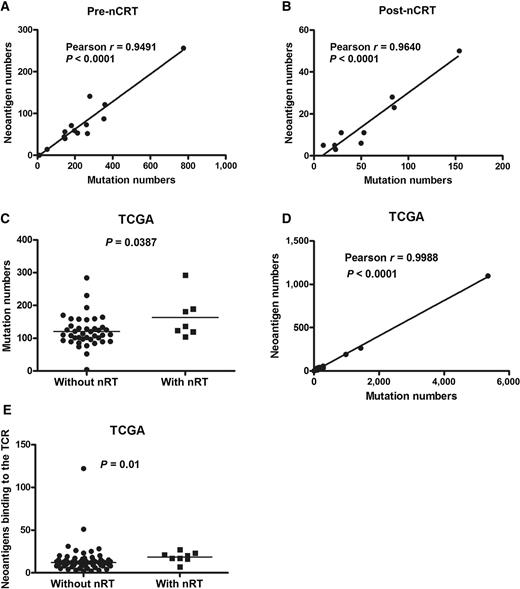
nCRT influences the neoantigen landscape of LARC. A, The quantity of neoantigens and mutations per tumor prior to nCRT (cohort 1; n = 14), using Pearson correlation. B, The quantity of neoantigens and mutations per tumor post-nCRT (cohort 1, n = 9), using Pearson correlation. C, The mutation burden in patients post-nCRT (n = 7) and patients without nCRT (n = 41) from TCGA data, using Student t test. D, The candidate neoantigens and mutation burden from TCGA data, using Pearson correlation. E, The neoantigens binding to the TCR in patients post-nCRT and patients without nCRT (from TCGA data), using Mann–Whitney test. Statistical significance was set at P < 0.05.
nCRT influences the neoantigen landscape of LARC. A, The quantity of neoantigens and mutations per tumor prior to nCRT (cohort 1; n = 14), using Pearson correlation. B, The quantity of neoantigens and mutations per tumor post-nCRT (cohort 1, n = 9), using Pearson correlation. C, The mutation burden in patients post-nCRT (n = 7) and patients without nCRT (n = 41) from TCGA data, using Student t test. D, The candidate neoantigens and mutation burden from TCGA data, using Pearson correlation. E, The neoantigens binding to the TCR in patients post-nCRT and patients without nCRT (from TCGA data), using Mann–Whitney test. Statistical significance was set at P < 0.05.
The mutational landscape from TCGA data analysis of rectal cancer with and without nCRT showed that the median nonsynonymous mutation burden was 163 in tumors from patients with nCRT compared with 120 in patients without nCRT (Student t test, P = 0.0387; Fig. 2C). The median candidate neoantigens per tumor was 22 (range, 0–55), and the quantity of neoantigens per tumor correlated with mutation burden (Pearson r = 0.9988, P < 0.0001; Fig. 2D). The median putative neoantigens binding to the TCR was 18 in with nCRT patients compared with 14 in without nCRT (Mann–Whitney test, P = 0.01, Fig. 2E).
Immune activation is related to neoantigens arising from mutation burden
To further confirm that immune activation following nCRT was related to neoantigens arising from mutation burden, the correlation between the number of mutations and the expression of all genes in rectal cancer from the TCGA DNA exome-seq and RNA-seq data was studied. An ordered list of 354 significant related genes was generated (Pearson r > 0.8 or r <−0.8, P < 0.01) for the Reactome pathway database analysis. The enriched pathways focused on the immune system, signal transduction, and developmental biology. An association was identified between mutation burden and enrichment of immune activation–related pathways, including alpha-defensins, IL2 family signaling, and other several interleukin-related pathways (interleukin receptor SHC signaling, interleukin-19, 20, 22, 24, 26, 28, and 29 signaling, interleukin-3, 5 and GM-CSF signaling, interleukin-17 signaling; Table 1).
RT combined with anti–PD-1 enhances control of tumor growth
To understand the contribution of RT to immune-checkpoint blockade, we utilized the MC38 colorectal cancer mouse model. Mice with right leg tumors received irradiation (RT), anti–PD-1/PD-L1 (from now on referred to as PD1/PDL1), or both treatments delivered sequentially (RT + PD1 or RT + PDL1; Fig. 3A). Tumor growth was controlled by RT, PD1, RT + PD1, and RT + PDL1 (P = 0.0163, P = 0.02, P < 0.0001, and P = 0.0035, respectively), and tumor growth was well controlled when RT + PD1 was administered compared with either treatment alone (P = 0.0037and P = 0.0021). No significant differences among PDL1, RT, and RT + PDL1 treatments were seen (Fig. 3B–D).

RT combined with anti–PD-1 enhances tumor growth control in a mouse model. A, Schematic of the experimental setup. Yellow arrow: location of transplantation. Timeline starts from original tumor implantation (day 0). Black arrows: treatments given. B, MRI images of combination RT + PD1 (RT combined with anti–PD-1)-treated tumors and baseline/control tumors. C and D, Total tumor growth for MC38 tumors after the indicated treatment. Radiotherapy: RT (n = 9); anti–PD-1: PD1 (n = 8); anti–PD-L1: PDL1 (n = 9); RT combined with anti–PD-1 or anti–PD-L1: RT + PD1 (n = 8), and RT + PDL1 (n = 9), respectively. C, Normalized values; D, raw values. For normalization, volumes were divided by average of untreated controls (V/Vcont) to account for differences in growth between different treated groups, using a mixed-effect linear model. E, Survival after RT and/or anti–PD-1 (left) or anti–PD-L1 (right). Shown are overall P values. The P values for RT + PD1 and RT or anti–PD-1 alone are P = 0.046 and P = 0.042, respectively. Control is an isotype-matched antibody. Using the log-rank test, statistical significance was set at P < 0.05.
RT combined with anti–PD-1 enhances tumor growth control in a mouse model. A, Schematic of the experimental setup. Yellow arrow: location of transplantation. Timeline starts from original tumor implantation (day 0). Black arrows: treatments given. B, MRI images of combination RT + PD1 (RT combined with anti–PD-1)-treated tumors and baseline/control tumors. C and D, Total tumor growth for MC38 tumors after the indicated treatment. Radiotherapy: RT (n = 9); anti–PD-1: PD1 (n = 8); anti–PD-L1: PDL1 (n = 9); RT combined with anti–PD-1 or anti–PD-L1: RT + PD1 (n = 8), and RT + PDL1 (n = 9), respectively. C, Normalized values; D, raw values. For normalization, volumes were divided by average of untreated controls (V/Vcont) to account for differences in growth between different treated groups, using a mixed-effect linear model. E, Survival after RT and/or anti–PD-1 (left) or anti–PD-L1 (right). Shown are overall P values. The P values for RT + PD1 and RT or anti–PD-1 alone are P = 0.046 and P = 0.042, respectively. Control is an isotype-matched antibody. Using the log-rank test, statistical significance was set at P < 0.05.
Kaplan–Meier analysis showed that PD1, RT, RT + PD1, PDL1, and RT + PDL1 improved the survival of mice (P = 0.001 and P = 0.018 for comparisons of PD1 and PDL1 treatment groups, respectively). The largest improvement in survival was observed in the RT + PD1 group. When compared with RT or PD1 alone, RT combined with PD1 still improved the survival significantly (P = 0.046 and P = 0.042, respectively). No significant differences among PDL1, RT, and RT + PDL1 groups were found (Fig. 3E).
Mutation burden and neoantigens correlate with the response to nCRT
The analysis of whole-exome sequencing indicated that rectal cancers with higher mutation burden were more sensitive to nCRT (Figs. 4 and 5A). The results showed high numbers of somatic mutations in pre-nCRT biopsies, which were associated with TRG; Pearson r = −0.5418, P = 0.0454; Fig. 5A). The potential mutation-associated neoantigen numbers were negatively correlated with TRG but were not statistically significant (Pearson r = −0.3684, P = 0.1949; Fig. 5B). Target-capture sequencing of plasma ctDNA and matched normal tissue DNA (cohort 2) was performed to detect somatic mutations in each sample, achieving a mean sequencing coverage of 2,313 × (914–3,792×) for plasma ctDNA and 1,675 × (765–2,649×) for normal tissue DNA. The correlation between the TMB of ctDNA and the TRG varied among the patients (mean 9.76 mutation/Mb; range, 4–16 mutations/Mb; Fig. 5C). TMB was associated with the TRG (Pearson r = −0.3636, P = 0.0179; Fig. 5D). The mean TMB was higher in pCR patients than in non-pCR patients (13 vs. 9.22, respectively; P = 0.0014; Fig. 5E). The patients were divided into two groups by assessing the percentage of viable residual tumor cells less or more than 30% in the resected specimens. The mean TMB was higher in the <30% group than in the >30% group (10.5 vs. 8.78, respectively; P = 0.0472; Fig. 5F).

Mutation burden correlated with patients’ response to nCRT. Paired pre- and post-nCRT tumors from 2 LARC patients. TRG of case 4 with higher mutation number is 0, complete regression, better response. TRG of case 3 with lower mutation number is 3, poor response. The H&E staining shows a typical rectal adenocarcinoma. The MRI images show the pre-nCRT and post-nCRT tumors.
Mutation burden correlated with patients’ response to nCRT. Paired pre- and post-nCRT tumors from 2 LARC patients. TRG of case 4 with higher mutation number is 0, complete regression, better response. TRG of case 3 with lower mutation number is 3, poor response. The H&E staining shows a typical rectal adenocarcinoma. The MRI images show the pre-nCRT and post-nCRT tumors.

Mutation burden and neoantigens of LARC correlated with the response to nCRT. A and B, Cohort 1 (n = 14). A, Mutation numbers in pre-nCRT biopsies with the different TRG, using Pearson correlation. B, The mutation-associated neoantigens in pre-nCRT biopsies with the different TRG, using Pearson correlation. C–F, Cohort 2 (n = 42). C, TMB in pre-nCRT ctDNA. D, The correlation between TMB in pre-nCRT ctDNA and the TRG, using Pearson correlation. E, The TMB in pCR patients (n = 6) and non-pCR patients (n = 36), using Student t test. F, The TMB in residual tumor cells in the <30% group (n = 24) and in the >30% group (n = 18), using Student t test. Statistical significance was set at P < 0.05.
Mutation burden and neoantigens of LARC correlated with the response to nCRT. A and B, Cohort 1 (n = 14). A, Mutation numbers in pre-nCRT biopsies with the different TRG, using Pearson correlation. B, The mutation-associated neoantigens in pre-nCRT biopsies with the different TRG, using Pearson correlation. C–F, Cohort 2 (n = 42). C, TMB in pre-nCRT ctDNA. D, The correlation between TMB in pre-nCRT ctDNA and the TRG, using Pearson correlation. E, The TMB in pCR patients (n = 6) and non-pCR patients (n = 36), using Student t test. F, The TMB in residual tumor cells in the <30% group (n = 24) and in the >30% group (n = 18), using Student t test. Statistical significance was set at P < 0.05.
Immune activity correlates with the response to nCRT
To further investigate the correlation between gene expression and response to nRT, mRNA expression in pretherapy biopsies of cohort 3 was profiled into responding (n = 19) and nonresponding (n = 47) groups. A supervised method (SAM) was used to find statistical significance (adjusted P < 0.05) in differentially expressed genes between responding and nonresponding groups. A total of 59 genes were differentially expressed between these two subgroups (P < 0.05, fold change >1.5), with most genes presenting significantly higher expression in the responding group and 4 genes with lower expression (Supplementary Fig. S3). Reactome pathway analysis showed that the immune activation–related pathways were enriched, including interleukin-10 signaling, chemokine receptors bind chemokines, cytokine signaling in immune system, peptide ligand-binding receptors, immune system, PD-1 signaling, interferon signaling, and costimulation factors within the CD28 family (Supplementary Table S10).
We also compared responding and nonresponding rectal cancer pretreatment biopsies from GEO data (GSE 45404) consisting of 42 patients who received nCRT with conventional fractionation (≥50 Gy in 28 fractions, 1.8 Gy/day, 5 sessions per week) and 5-fluorouracil (5-FU)-based chemotherapy. The readings from the pretreatment patients responding (n = 19) and nonresponding (n = 23) to chemoradiotherapy were compared. Reactome pathway analysis showed similar results to cohort 3 (Supplementary Table S10).
The correlation between infiltrating immune cells and response to nCRT was further assessed using CIBERSORT. The results of cohort 3 showed that the fractions of CD8+ T cells (19% vs. 12%) and activated CD4+ memory T cells (0.47% vs. 0) in the responding group were higher than those in the nonresponding group. In the nonresponding group, the fraction of regulatory T cells (Treg) was higher than that in the responding group (2.29% vs. 0.59%). GSE 45404 data also showed a significant increase in the fractions of CD8+ T cells (1.99% vs. 0%) and activated CD4+ memory T cells (7.67% vs. 2.97%) in the responding group compared with the nonresponding group (Supplementary Fig. S4).
PD-L1 expression negatively correlates with prognosis
The expression pattern of PD-L1, PD-1, and PDL2 in tumors and corresponding nontumor tissue of cohort 4 was studied using IHC. PD-L1 was expressed not only on tumor cells but also on TILs. The majority of PD-L1 expression was observed in the tumor cells, whereas weak expression was observed on TILs (Fig. 6A). A high expression of PD-L1 was detected in epithelial cells with elevated expression in tumor tissue compared with normal tissue (Z = −5.538, P < 0.0001).

Association between PD-L1 and PD-1 expression and prognosis with colorectal cancer using IHC (cohort 4). A, Expression of PD-1 and PD-L1 in the indicated colorectal cancer tissues using IHC analysis. Positive staining is shown in brown. B, OS. Kaplan–Meier analysis of TNM stage I–III colorectal cancer patients in cohort 4. C, Kaplan–Meier analysis of the correlation between PD-L1 expression and DFS in patients with rectal cancer in cohort 4. D, Kaplan–Meier analysis of the correlation between PDL1 expression and OS in patients with rectal cancer in cohort 4. The number of patients per group indicated on graphs. Using the log-rank test, statistical significance was set at P < 0.05.
Association between PD-L1 and PD-1 expression and prognosis with colorectal cancer using IHC (cohort 4). A, Expression of PD-1 and PD-L1 in the indicated colorectal cancer tissues using IHC analysis. Positive staining is shown in brown. B, OS. Kaplan–Meier analysis of TNM stage I–III colorectal cancer patients in cohort 4. C, Kaplan–Meier analysis of the correlation between PD-L1 expression and DFS in patients with rectal cancer in cohort 4. D, Kaplan–Meier analysis of the correlation between PDL1 expression and OS in patients with rectal cancer in cohort 4. The number of patients per group indicated on graphs. Using the log-rank test, statistical significance was set at P < 0.05.
Expression of PD-L1 was correlated with M stage (Spearman r = 0.13, P = 0.03), differentiation (Spearman r = 0.131, P = 0.029), and histologic type (U = 3.8158, P = 0.000136). PD-L1 expression in liver metastasis tissues was lower than expression in paired primary tumor tissues (Z = −2.346, P = 0.019; Supplementary Table S11). Positive PD-L1 expression in colorectal cancer tissues was associated with a shorter overall survival (OS; P = 0.065) and disease-free survival (DFS; P = 0.06; Supplementary Fig. S5A and S5B), although the tendency was not statistically significant. For stage I–III colorectal cancer patients, positive PD-L1 expression was significantly associated with poor OS (P = 0.019; Fig. 6B), whereas for stage IV colorectal cancer patients, positive PD-L1 expression was significantly associated with favorable prognosis of colorectal cancer (P = 0.001; Supplementary Fig. S5C).
The association between PD-L1 expression and prognosis of rectal cancer indicated that positive PD-L1 expression was significantly associated with poor prognosis of rectal cancer (for DFS, P = 0.031; for OS, P = 0.043; Fig. 6C and D). No significant correlation between PD-L1 and prognosis of colon cancer was found (Supplementary Fig. S5D and S5E). We further performed subgroup analysis in different stages of colon and rectal cancers to ascertain the effect of primary tumor location on the correlation. For stage I–III rectal cancer patients, positive PD-L1 expression was significantly associated with poor OS (P = 0.023; Supplementary Fig. S6A). In stage IV rectal cancer, PD-L1 expression was associated with better OS (P = 0.011; Supplementary Fig. S6B). However, no significant correlation between PD-L1 and prognosis of colon cancer, whether in stage I–III (P = 0.069, Supplementary Fig. S6C) or in stage IV (P = 0.169; Supplementary Fig. S6D), was found.
PD-1 was also expressed in tumor cells and TILs, with TILs having the highest expression. PD-1 expression was negatively correlated with tumor cell differentiation (Spearman r = −0.135, P = 0.022), but no significant correlation between PD-1 and other clinical–pathologic findings was found (Supplementary Table S11; Supplementary Fig. S7A–S7D).
PD-L2 was expressed not only in tumor cells, but also in TILs. However, the majority of PD-L2 expression was in tumor cells (Supplementary Fig. S8A). High PD-L2 expression was significantly associated with better OS (P = 0.001; Supplementary Fig. S8B) in all stage colorectal cancer patients. Specifically, for stage I–III colorectal cancer patients, high PD-L2 expression was significantly associated with better OS (P = 0.042; Supplementary Fig. S8C), whereas for stage IV colorectal cancer patients, high PD-L2 expression was associated with poor prognosis (P = 0.067; Supplementary Fig. S8D). We also performed subgroup analysis in different stages of colon and rectal cancers. For colon cancer patients, a significant positive correlation between PD-L2 and prognosis in all stages was seen (P < 0.0001; Supplementary Fig. S8E). However, no significant correlation between PD-L2 and prognosis was found in stage I–III or stage IV alone. For all stage rectal cancer patients, no significant correlation between PD-L2 and prognosis was seen. For stage I–III rectal cancer patients, there was no significant correlation between PD-L2 and prognosis, but in stage IV rectal cancer, PD-L2 expression was associated with poor OS (P < 0.0001; Supplementary Fig. S8F).
PD-L1 and PD-1 after nCRT correlates with CD45RO, CD8, and outcomes
To determine whether PD-L1 and PD-1 were associated with clinical and pathologic features in LARC patients, TMA analysis of 296 LARC patients from cohort 5 was performed. The patients’ profile is listed in Supplementary Table S5, and the tumor-infiltrating cytotoxic lymphocytes are shown in Fig. 7A and B. No significant correlation was found between PD-L1, PD-1, and clinical–pathologic parameters observed (Supplementary Table S12).

Expression of PD-L1 and PD-1 in post-nRT rectal cancer tissue samples and therapeutic outcome for nRT using IHC (cohort 5). A, Representative images of PD-L1 expression on tumor cells and TILs. B, Representative images of PD-1 expression on tumor cells and TILs, as well as CD8 expression on TILs. C, Kaplan–Meier analysis of the correlation between PD-L1 expression and DFS in patients with low CD8 expression in cohort 5. PD-L1–negative n = 67; PD-L1–positive n = 45. Using the log-rank test, statistical significance was set at P < 0.05.
Expression of PD-L1 and PD-1 in post-nRT rectal cancer tissue samples and therapeutic outcome for nRT using IHC (cohort 5). A, Representative images of PD-L1 expression on tumor cells and TILs. B, Representative images of PD-1 expression on tumor cells and TILs, as well as CD8 expression on TILs. C, Kaplan–Meier analysis of the correlation between PD-L1 expression and DFS in patients with low CD8 expression in cohort 5. PD-L1–negative n = 67; PD-L1–positive n = 45. Using the log-rank test, statistical significance was set at P < 0.05.
To understand the relationship between PD-1, PDL-1, CD45RO, and CD8, the correlation coefficients of PD-1, PD-L1, CD45RO, and CD8 expression among all patient samples were calculated. PD-L1 was significantly correlated with CD45RO (r = 0.157, P = 0.009, Spearman test) and CD8 (r = 0.278, P = 0.000, Spearman test). No correlation was found between PD-1 and CD8 or CD45RO (Supplementary Table S12).
Our previous work demonstrated that CD45RO expression significantly correlates with prognosis of LARC patients with neoadjuvant radiotherapy (39). To determine if prognostic associations existed between the expression of PD-L1, PD-1, CD8, and patient survival, Kaplan–Meier survival curves were plotted. Again, no significant correlation between DFS or OS and the expression of the proteins was found (Supplementary Fig. S9A–S9F).
These results suggested that PD-1, PD-L1, and CD8 were not independent prognostic factors for patient survival. However, if the patient survival was plotted against a combination of PD-L1 with CD8, in the CD8-low expression group, a significant negative correlation was observed in DFS (P = 0.042; Fig. 7C). It seemed that CD8-high expression was not associated with DFS and OS (Supplementary Fig. S10A and S10B). With regard to the association of patient survival with the combination of PDL1 with CD45RO, in the CD45RO-low expression group, a negative correlation was observed in overall patient survival (P = 0.081) or DFS (P = 0.099), although it was not statistically significant (Supplementary Fig. S10C and S10D).
Discussion
We analyzed somatic gene expression in irradiated and nonirradiated rectal cancer samples from GEO data to assess the influence of nCRT on the immune condition. Our study indicated that chemoradiotherapy could be able to induce an immune response in rectal cancer patients. Posttreatment LARC is characterized by increased expression of genes involved in immune response pathways, mainly composed of cytotoxic T and TH cells, along with strong activation of antigen presentation, peptide ligand-binding receptors, CD28 costimulatory signals, interferon signaling, and other cytokine signaling in the immune system.
T-cell activation requires a two-step process that includes engagement of the TCR to an antigen presented by an antigen-presenting cell (APC), and a second costimulatory signal delivered by the engagement of CD28 to its ligands CD80 and CD86 (40). Tumor cells expressing HLA class I present tumor-associated antigens on their cell surface and are recognized by CD8+ cytotoxic T cells. Our analysis showed that nCRT led to a significant increase in CD28, CD86, and HLA class I and II molecule expression in rectal cancer cells. The class II molecule is expressed on the surface of professional APCs and to some degree on cancer cells (41) and plays a central role in the immune system by presenting peptides derived from extracellular proteins. Studies have shown the direct requirement for competent HLA class II pathway stimulation in the reduction of HLA class I–mediated response for an effective immunotherapy approach (42). HLA class II antigen expression in colorectal cancer tumors is a favorable prognostic marker (43). We noticed that T-cell activation in posttreatment LARC was mainly through IFNγ signaling activation and increased PI3K signaling. We further analyzed the expression of T-cell differentiation and activation markers. Differentiation markers (KLRG-1 and CD45 isotypes) and activation markers (CD69, CD25, and CD38) were increased in LARC following nCRT compared with pre-nCRT conditions. It was clear that nCRT could induce immune activation in LARC patients.
The mechanism by which radiation induces adaptive immunity remains unclear. Twyman-Saint and colleagues report major tumor regressions in a subset of patients with metastatic melanoma treated with an anti-CTLA4 and radiation, which was reproduced in mouse models (26). Their study demonstrates that radiation can diversify the TCR repertoire of TILs and shape the repertoire of expanded clones. Reits and colleagues demonstrate that radiation can enhance MHC class I expression by modulating the peptide repertoire (44).
Interest in the relationship between somatic mutational burden and antitumor immune response motivated us to examine the differences in the mutational landscape between the pre- and posttreatment rectal cancers by sequencing the exomes of LARCs. Our analysis revealed that nCRT influenced the mutational landscape of LARC and induced novel somatic mutations, and we further validated the results in TCGA data sets. The most impactful finding from this study was the correlation between immune activation and mutation burden in post-nCRT treated rectal cancers.
Although the exact mechanism of the enhanced immune response needs to be further clarified, our observations clearly showed that neoantigens are associated with nonsynonymous mutation burden, which is consistent with the hypothesis that recognition of neoantigens derived from somatic mutations is important for the activity of the immune response, regardless of nCRT treatment. The tumors with higher mutational load in melanoma, lung cancer, and MMR-deficient colorectal cancers have a higher rate of response to checkpoint blockade therapy (22, 23, 45). These data provide further insight on the idea that mutation-associated neoantigen recognition is an important component of the endogenous antitumor immune response.
Numerous studies have shown that chemoradiotherapy induces local immune reactions that contribute to tumor regression through inflammatory infiltration. Our previous work also demonstrates that the density of CD45RO+ TILs can predict tumor downstaging and long-term outcomes for rectal cancer following neoadjuvant radiotherapy (39). Evidence shows that a high rate of response to checkpoint therapy is based on boosting tumor-specific immune activity. Therefore, we hypothesized that rectal cancer patients who responded to nCRT could be good candidates for checkpoint blockade immunotherapy, especially for the patients without pCR. Our preclinical mouse experiments demonstrated that radiotherapy could enhance the efficiency of anti–PD-1, which further supported our hypothesis.
In this work, we demonstrated that a higher TMB in pretreatment tumors is correlated with a lower TRG. We also found that the immune activation–related genes and pathways were enriched in the patients who were responding to the nCRT. Heterogeneous immune cell infiltration was present in responding and nonresponding patients, and the responding patients displayed a higher infiltration of CD8+ and activated CD4+ memory T cells, whereas the nonresponding patients displayed a significantly higher Treg infiltration. Our results indicated that patients’ immune activity is related to the somatic mutation burden and associated with nCRT. Mutation burden could be a useful biomarker to stratify patients into sensitive and resistant categories to nCRT.
Several studies have addressed that tumor shrinkage induced by chemoradiotherapy is not simply dependent on direct damage to tumor cells but is also affected by the host immune activity. Immune infiltration could be a biomarker to predict the response to nCRT in rectal cancer. Yasuda and colleagues previously analyzed the density of CD4+ and CD8+ T lymphocytes in rectal cancer patients before nCRT and demonstrated that a higher density of lymphocytes was correlated with a better response to nCRT (46). Anitei and colleagues analyzed immunoscores, which score the presence of T lymphocytes, in rectal cancer patients and show low immunoscores for patients who did not respond to nCRT (47). Tumors with higher immune activity are considered to be immunogenic and tend to further evoke antitumor immune responses by neoantigens due to chemoradiotherapy, resulting in a better response to CRT. Studies demonstrate that irradiation can promote remodeling of the extracellular matrix (ECM) and tumor vasculature by increasing intratumoral oxygenation and pH and upregulating the expression of cell adhesion molecules. This leads to increased recruitment of immune effector cells into the tumor (48).
We further investigated the prognostic value of the checkpoint molecules PD-1, PD-L1, and PD-L2 in colorectal cancer. PD-L1 expression was correlated with poor prognosis of rectal cancer but not colon cancer. Increasing evidence suggests that colorectal cancer should be considered as a heterogeneous disease, with colon and rectal cancers showing multiple clinicopathologic and molecular distinctions, including the immune microenvironment (49, 50). The TILs in colorectal cancer and its microenvironment are associated with survival, and this prognostic correlation differs according to tumor location (51).
In rectal patients without nCRT, PD-L1 expression negatively correlated with prognosis in stage I–III rectal cancer patients and positively correlated in stage IV rectal cancers. The expression pattern and correlation with prognosis of PD-L2, another PD-1 ligand, was different from that of PD-L1. PD-L2 expression was correlated with better prognosis of colon cancer but poor prognosis of stage IV rectal cancer, indicating that the biological roles of PD-L1 and PD-L2 were different between colon and rectal cancers. Our results are consistent with the survival analysis of colorectal cancer RNA-seq data from TCGA presented in the Human Protein Atlas (www.proteinatlas.org). However, our results are inconsistent with the study by Wang and colleagues (52), which shows that PD-L2 overexpression in colorectal cancer tumor cells associates with poor OS of patients. It was shown that in both early colorectal cancer (AJCC stages I–II) and advanced colorectal cancer (stages III–IV), higher PD-L2 expression associated with worse OS. However, it should be noted that their study cohort was mostly composed of colon cancer and only had two rectal cancer samples. For stages of samples, the cohort had only four stage IV samples, and therefore, their results mainly reflect the expression of PD-L2 in stage I–III colon cancer and its prognostic significance. We think that the difference between their results and ours might be due to the different composition of the study cohort and a different antibody used in the study.
In patients with neoadjuvant radiotherapy, no significant correlation between PD-L1 expression and prognosis was found. Colorectal cancer is considered as an immune cold tumor, except in high mutation colorectal cancer with MSI-H or POLE mutation (53). Multiple factors produced by tumor and stromal cells contribute to the inhibition of antitumor immune response. Interaction of PD-L1 with PD-1 inhibits T-cell activation and cytokine production (54, 55). In tumor microenvironments, elevated PD-L1 can result in T-cell exhaustion (56). T cells, thus, fail to maintain an energetic status to fight tumor cells and are rendered tolerant to tumor antigens or exhausted. Chemoradiotherapy could reprogram the immune-suppressive TME toward an immune-stimulating one. Following neoadjuvant radiotherapy, T-cell activation was initiated by the tumor-specific neoantigens resulting from nCRT, which could partially counteract the effect of PD-L1. Following neoadjuvant radiotherapy, PD-L1 was significantly correlated with CD45RO and CD8. In the CD8-low expression group, in which antitumor immune was poorly activated, PD-L1 expression was negatively correlated with DFS. Therefore, we propose that the addition of checkpoint blockade to nCRT may show significant efficacy in improving prognosis of rectal cancer. T-cell infiltration, such as CD8+ T cells, could be a potential biomarker to further stratify post-nCRT patients into future immunotherapy groups (CD8-high expression) or surgery alone group (CD8 low expression).
It is plausible that the immune features associated with nCRT could influence the response to immunotherapeutic strategies. The mutational landscape could provide a simple selection or stratification factor to identify populations of interest for such treatments, and its exploration as a predictive biomarker is warranted.
Altogether, this work establishes the link between somatic mutations and immune activity in rectal cancer patients following nCRT and supports the hypothesis that rectal cancer patients with nCRT could become potential candidates for checkpoint blockade immunotherapy. Further studies to identify the specific antigenic epitopes are expected. Therefore, we prudently assume that LARC patients’ mutation burden and immune activity are correlated with the response to nCRT. This would help to develop personalized cellular adoptive immunotherapy strategies in the clinical settings to optimally combine radiation and checkpoint blockade with PD-1 and CTLA-4 antibodies to achieve the best therapeutic benefits.
Disclosure of Potential Conflicts of Interest
No potential conflicts of interest were disclosed.
Authors' Contributions
Conception and design: D. Ji, H. Yi, D. Zhang, J. Gu
Development of methodology: D. Ji, H. Yi, D. Zhang, T. Zhan, Z. Li, J. Jia, M. Qiao, J. Xia, Z. Zhai, C. Song
Acquisition of data (provided animals, acquired and managed patients, provided facilities, etc.): D. Ji, H. Yi, D. Zhang, T. Zhan, Z. Li, M. Li, J. Jia, M. Qiao, J. Xia, Z. Zhai, C. Song
Analysis and interpretation of data (e.g., statistical analysis, biostatistics, computational analysis): D. Ji, H. Yi, D. Zhang, T. Zhan, Z. Li, J. Jia, M. Qiao, J. Xia, Z. Zhai, C. Song
Writing, review, and/or revision of the manuscript: D. Ji, H. Yi, D. Zhang, T. Zhan, Z. Li, J. Jia, M. Qiao, J. Xia, Z. Zhai, C. Song
Administrative, technical, or material support (i.e., reporting or organizing data, constructing databases): D. Ji, H. Yi, Z. Li, J. Jia, M. Qiao, J. Xia, Z. Zhai, C. Song
Study supervision: J. Gu
Acknowledgments
The authors would like to thank Dr. Bin Dong, the Department of Pathology, Peking University Cancer Hospital and Institute, for her technical assistance.
This work was supported by the National Natural Science Foundation (81772565 to D. Ji, 81372593 to J. Gu, and 81201965 to D. Ji), the Beijing Natural Science Foundation (7132052 to J. Gu), and the National High Technology Research and Development Program of China (863 Program; No. 2012AA02A506 to J. Gu partially, 2014AA020801 to M. Li partially).
The costs of publication of this article were defrayed in part by the payment of page charges. This article must therefore be hereby marked advertisement in accordance with 18 U.S.C. Section 1734 solely to indicate this fact.